In undergraduate courses, students create infographics that tell a story with numbers and pictures; they present data in an easily digestible and visually appealing manner to simplify complicated issues for a broader audience. Here are some examples.
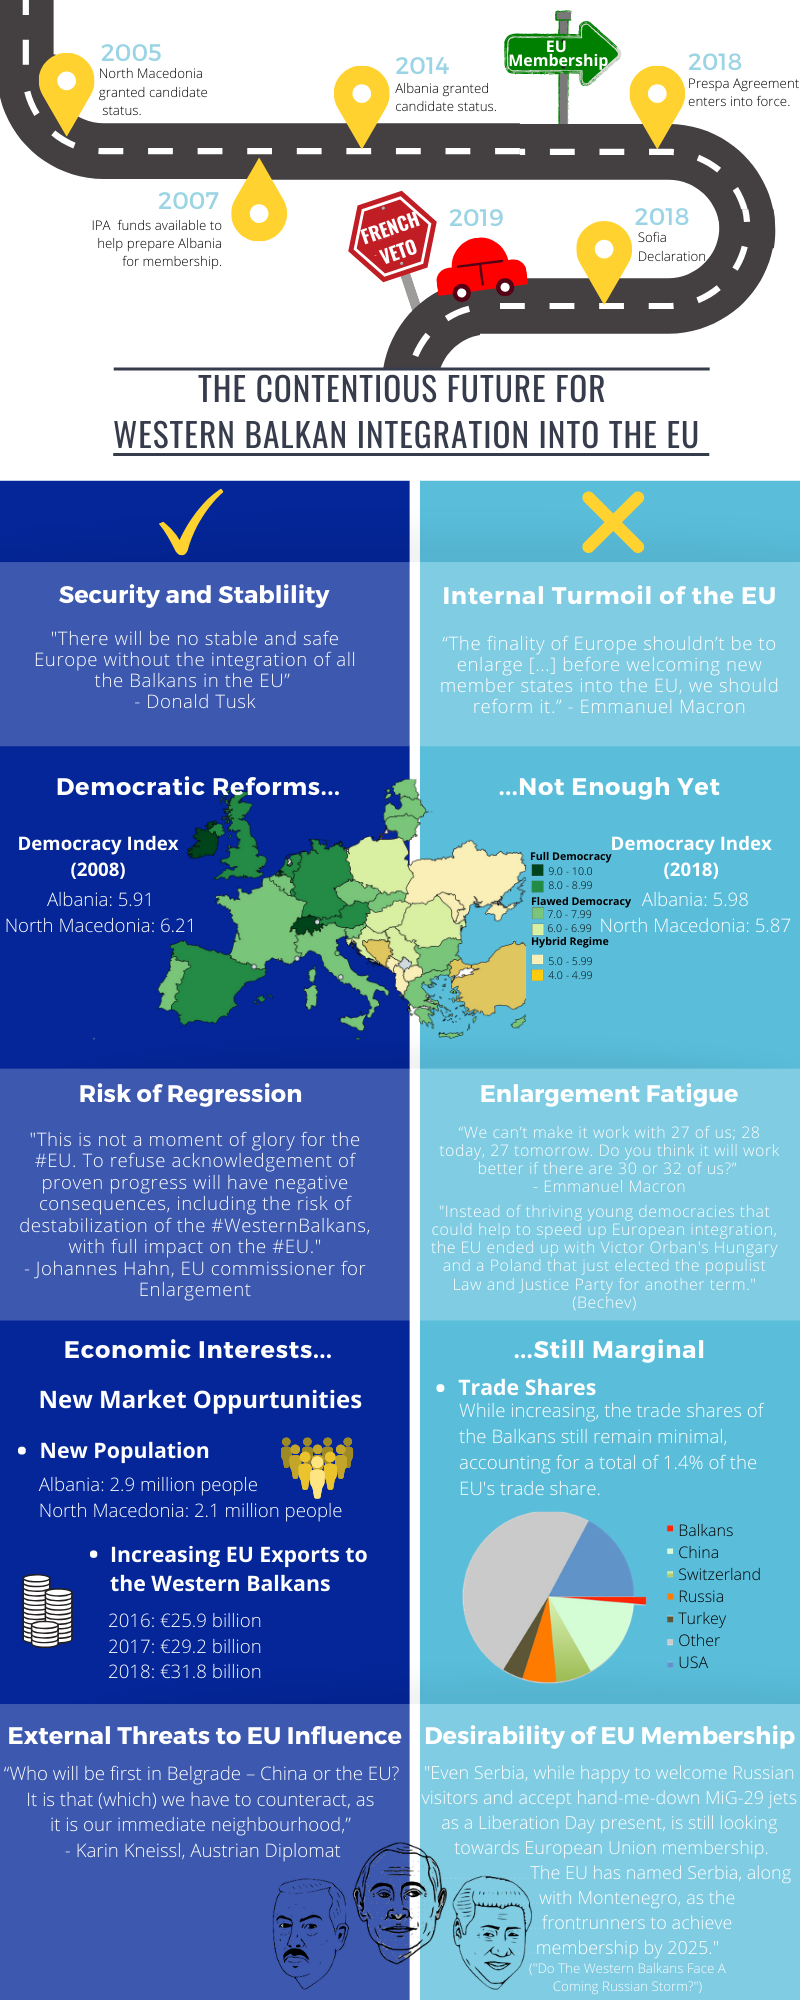
"The Contentious Future for Western Balkan Integration into the EU"
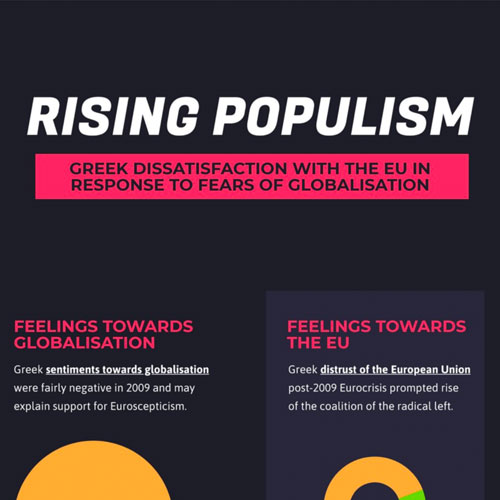
"Rising Populism: Greek Dissatisfaction with the EU in Response to Fears of Globalisation"
By Parminder Cheema, Husayn Jamal, Marie-Alice Moys, Jorge Saldana and Hermine Villedey
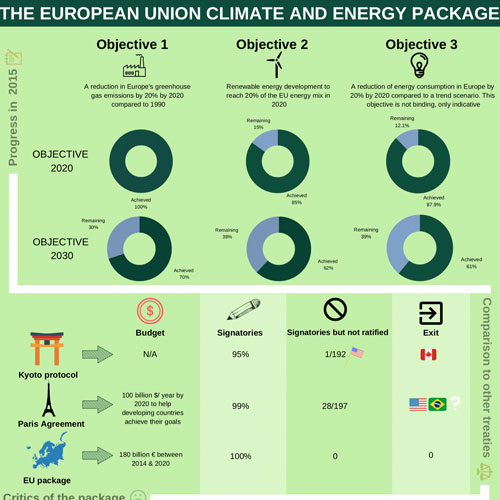
"The European Union Climate and Energy Package"
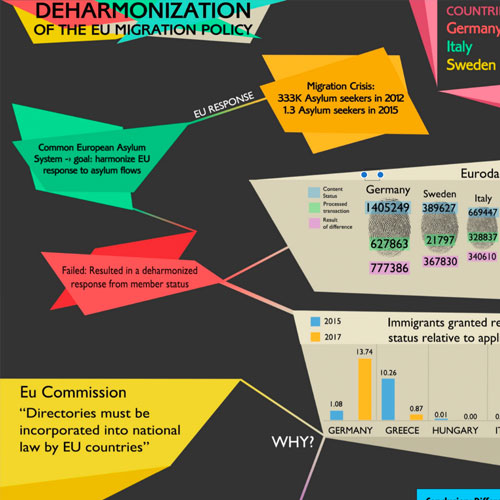
"Deharmonization of the EU Migration Policy"
By Ollie Couttolenc, Gabriel Helfant, Thomas Painter, Rachel Rowlands and Magali Vennin
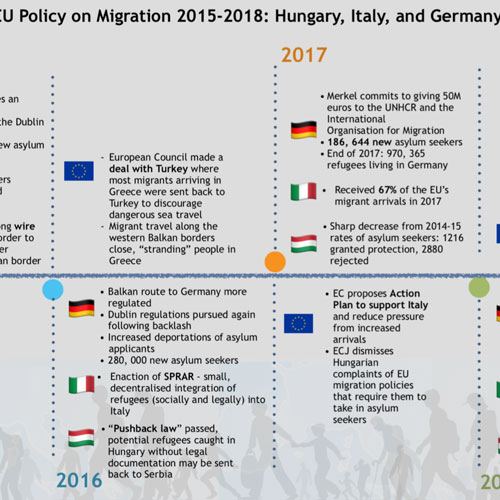
"EU Policy on Migration 2015-2018: Hungary, Italy, and Germany"
By Sophie Davis, Emma Fu, Kapinga Kalombo, Greta Kubiliute and Nousha Nematzadeh
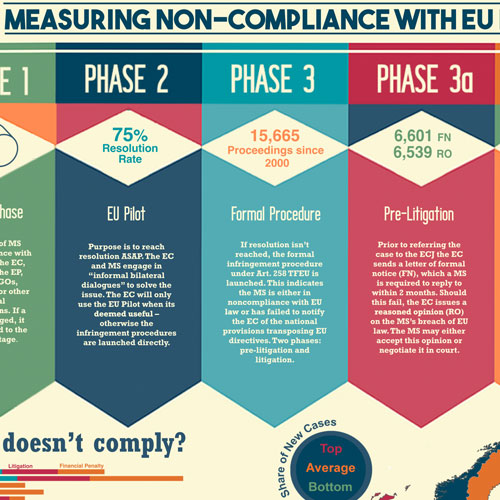
"EU Policy in Response to Irregular Migrant Flows (2011-2016)